

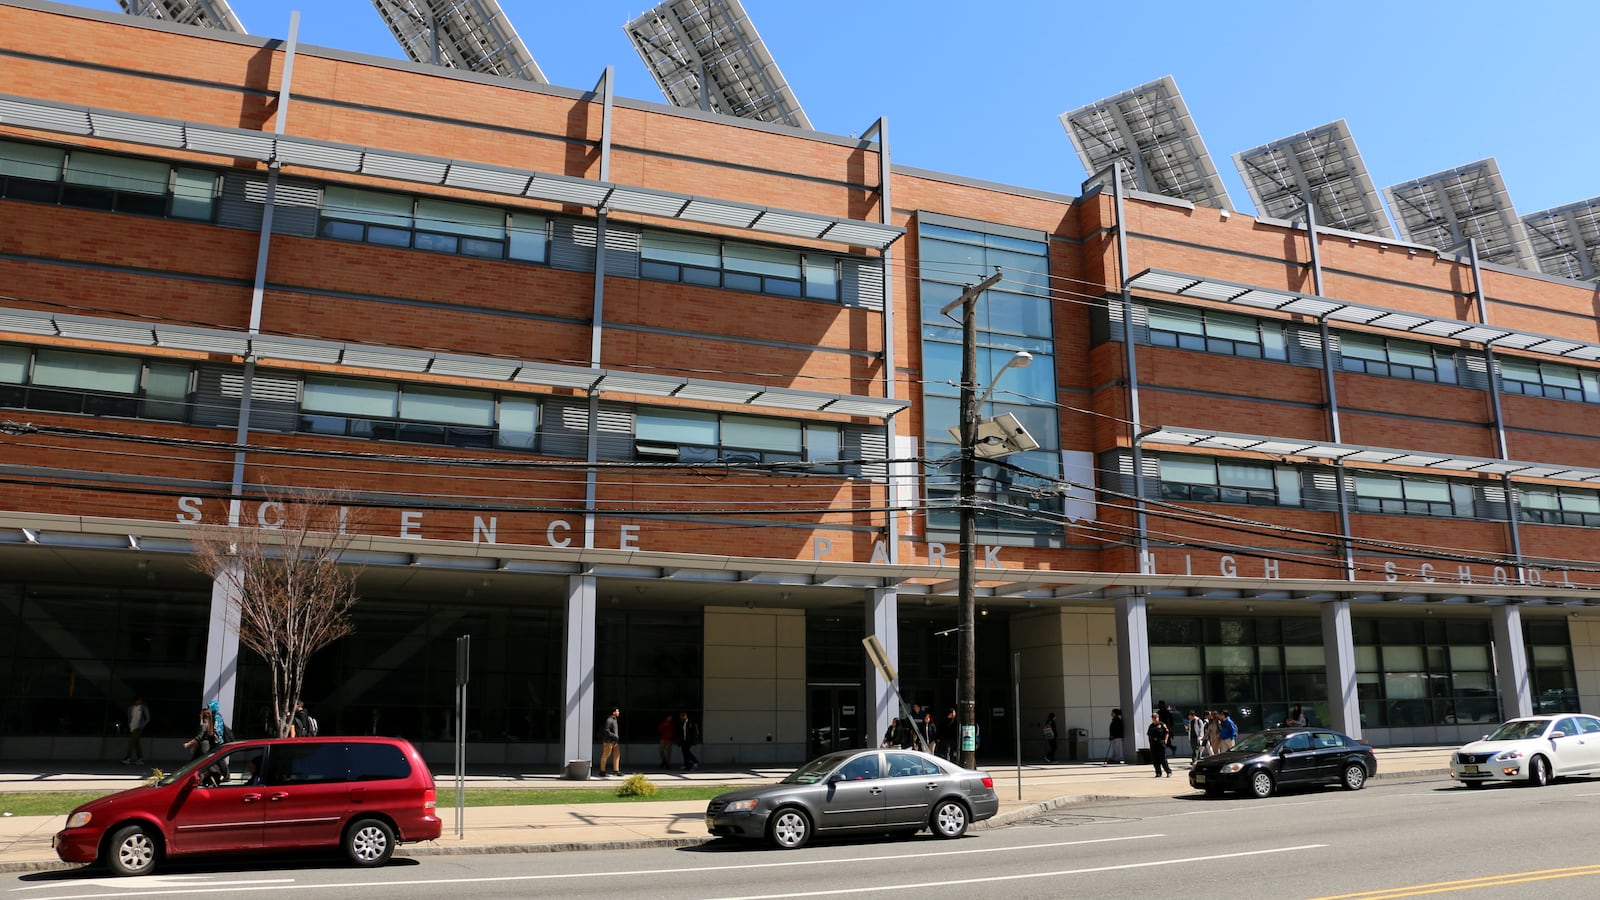
Central High School and Science Park High School sit about a mile apart in Newark’s Central Ward. Both are district-run public schools – yet the differences between them couldn’t be starker.
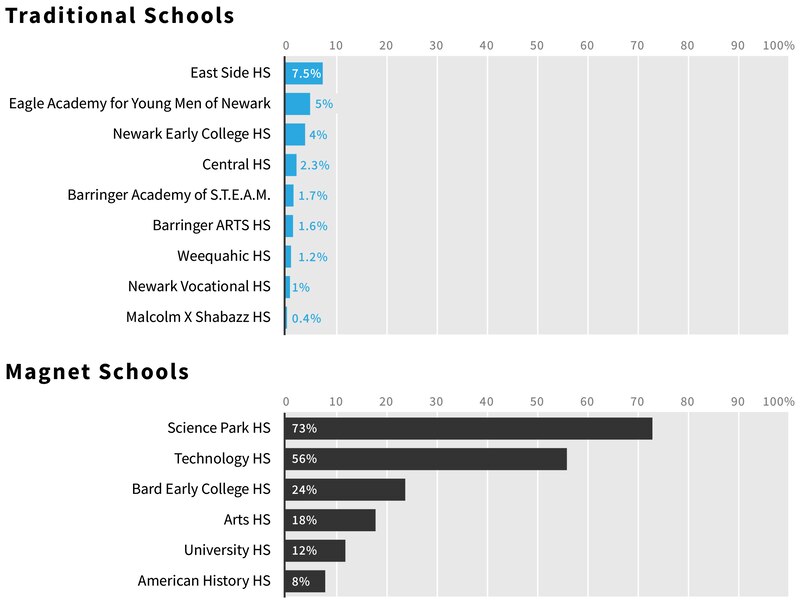
At Central, which is a traditional high school, at least a quarter of students had disabilities last academic year. At Science Park, which is a selective “magnet” school, just 7 percent did. And while 73 percent of Science Park students passed the state math exams in 2017, just over 2 percent of Central students did.
Those disparities are no coincidence. As a magnet school designed for high-achieving students, Science Park gets to screen applicants by their grades, attendance records, and test scores. Last year, just over 27 percent of rising ninth-graders who picked Science Park as their first choice in the city’s universal enrollment system were admitted.
Central, by contrast, must admit anyone it has room for. More than 98 percent of students who ranked it first last year got in.
Such disparities are true for all six of the city’s magnet schools and its eight traditional high schools, which are sometimes called “comprehensive” high schools.
The charts below illustrate the sharp divide between those schools, both in terms of the students they serve and the outcomes they get. As Newark’s new schools chief Roger León takes stock of the system, the disparities raise tough questions about why the traditional schools perform so much worse, at least by these measures, than the magnet schools – and how to change that when traditional schools are expected to serve the most challenging students while magnets get the top performers.
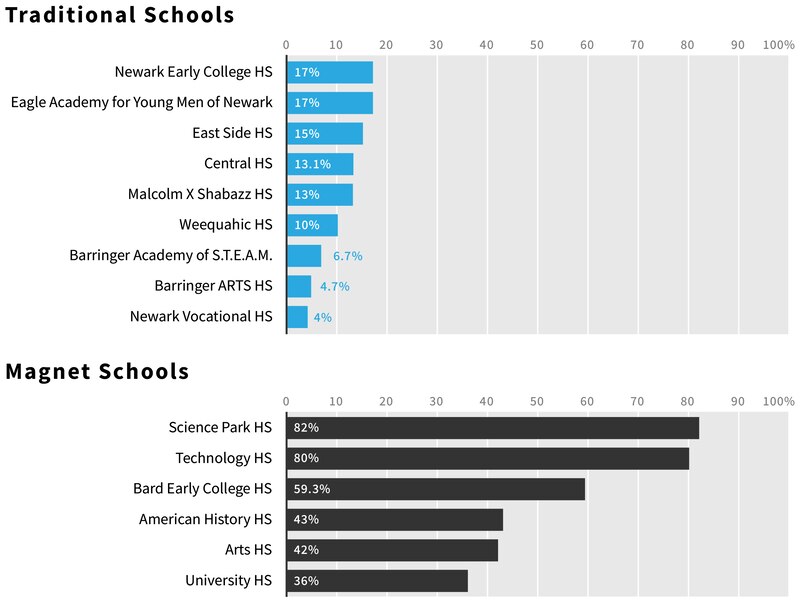
As the charts show, traditional schools serve more students with disabilities, more who are still learning English, and more who are “chronically absent,” meaning they miss at least 10 percent of school days. (Traditional and magnet schools enroll similar shares of students who qualify for free lunch.)
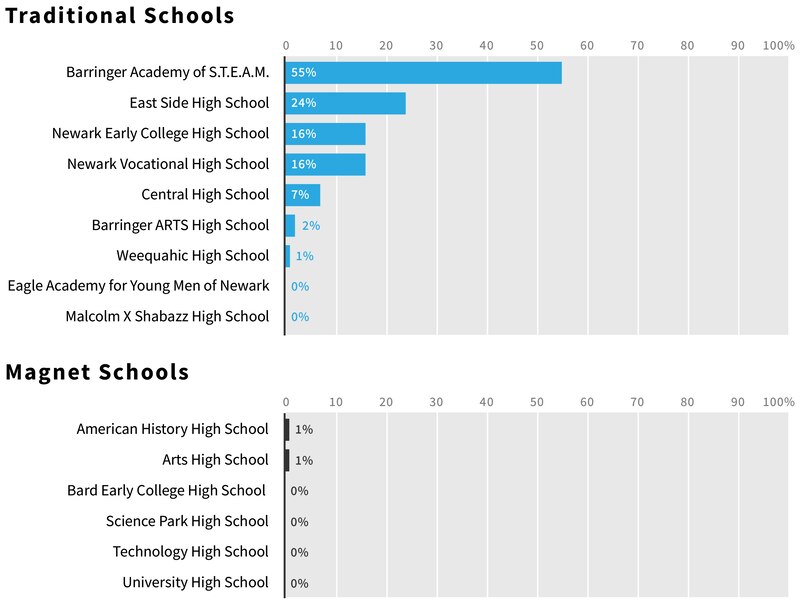
Outcomes at the traditional schools reflect their needier student bodies. Although performance varies across schools, far fewer students at the traditional schools pass the state exams than at magnet schools. And while the 2017 graduation rate at the magnet schools ranged from 87 to 98 percent, it ranged from just 60 to 77 percent at the traditional schools.
Indeed, those gaps persist even after high school. A recent report found that magnet school graduates are three times as likely as traditional school graduates to earn a college degree within six years.
Gregory Prince, Jr., who oversees a college-preparation program in several traditional high schools called “Pathways to College,” said magnet schools “skim the cream” by enrolling most of the system’s highest-performing students. Despite that, students in traditional schools still have the ability to achieve at high levels – yet they are often held to lower standards and given less challenging work, he said.
“These schools have incredible potential and these kids have incredible potential,” Prince said in an interview in July. “But the whole culture gives the impression that they’re in the leftover bin.”
While the charts highlight the disparities between Newark’s magnet and traditional high schools, they don’t represent the whole story.
First, they only include district schools – not privately operated charter schools or county-run vocational-technical high schools. Out of about 14,400 students who attended a public high school in Newark this past academic year, 45 percent went to a traditional high school, 24 went to a magnet school, 21 percent attended a charter school, and 10 percent went to a vocational-technical school.
Second, the test data shows what share of students at each high school met or exceeded the state’s grade-level expectations last year. However, those achievement levels don’t take into account where students started when they entered those schools, making it hard to know what impact the schools had on their performance. By design, the city’s magnet schools enroll many high-achieving students who would likely do well on the tests at any school.
To get a better sense of schools’ contribution to student achievement, the state calculates how much students at a given school improve each year compared to similar students in other schools. However, the state only calculates these “student growth percentiles” for students in grades four through eight. While some of Newark’s magnet schools include the middle-school grades, most of the traditional high schools do not, leaving them without growth scores.
Finally, it’s worth noting that while students at Newark’s magnet schools tend to perform better than their peers at traditional schools, there is great variation within those two groups. For example, the share of magnet-school students who passed the state math tests last year ranged from 73 percent at Science Park to just 8 percent at American History High School.
Still, even that 8 percent pass rate was higher than at any traditional school.
Students who are chronically absent
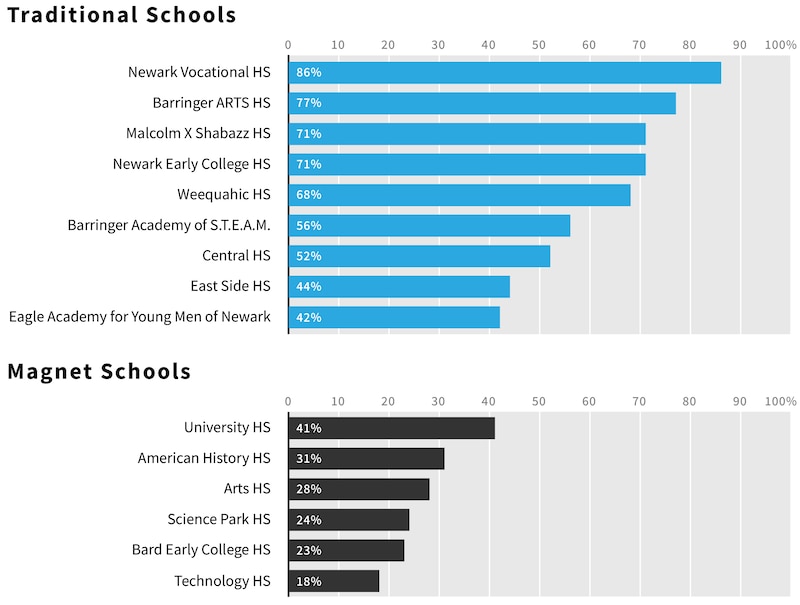
Students with disabilities
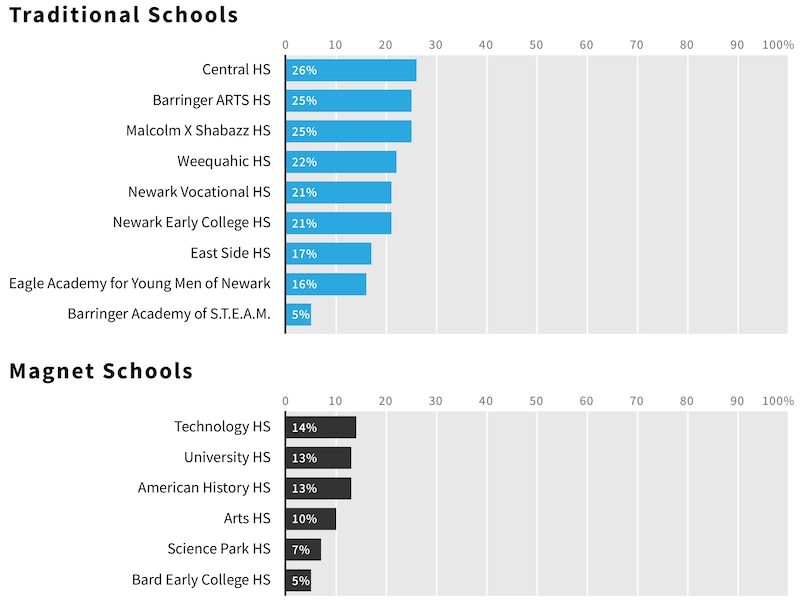
Students who are still learning English
Students who passed the PARCC English tests
Students who passed the PARCC math tests
Source: Newark Public Schools, school summaries. Graphics: Sam Park/Chalkbeat.