
A long-awaited report about the extent of overcrowding in the city schools was released today, showing that more than half a million city children attend school in buildings that crowded beyond capacity.
The group that put together the report, The Campaign for Fiscal Equity, also launched an interactive Web site aimed at spurring action to reduce the overcrowding. The Web site, OvercrowdedNYCschools.org, includes a searchable map of overcrowded school buildings, instructions for how to urge the city to improve its school building plan, and links to the report, titled “Maxed Out,” and the data used to compile it.
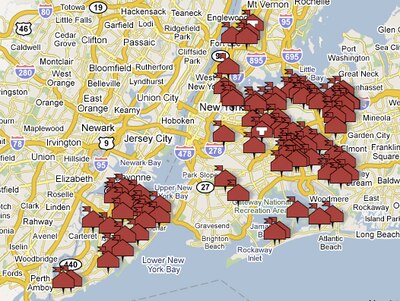
I used the site’s map tool to plot school buildings that are at 150 percent capacity or higher and found 117 schools that fell into that category. As the picture to the right shows, the most overcrowded school buildings are located on Staten Island and in Queens.
Helaine Doran, CFE’s deputy director, said in early February that the group’s overcrowding report would be released in a matter of days. At the time, Department of Education officials said alleviating crowding to the degree CFE is urging, by reducing class sizes, would cost upwards of “tens of billions” of dollars in both capital and operating expenses.
UPDATE: I just heard from Doran about why the report’s release was delayed from February until now. The sheer volume of data made getting the analysis “not so easy to square,” she said, and the group took some extra time to decide what on a strategy to recommend the city use in addressing the overcrowding program. But she said, “We think we have it right.”