Mayor Bill de Blasio has made reducing suspensions a key pillar of his education agenda. But even as the number of suspensions has tumbled nearly 32 percent over the past five years, the punishments continue to be unevenly distributed across the city.
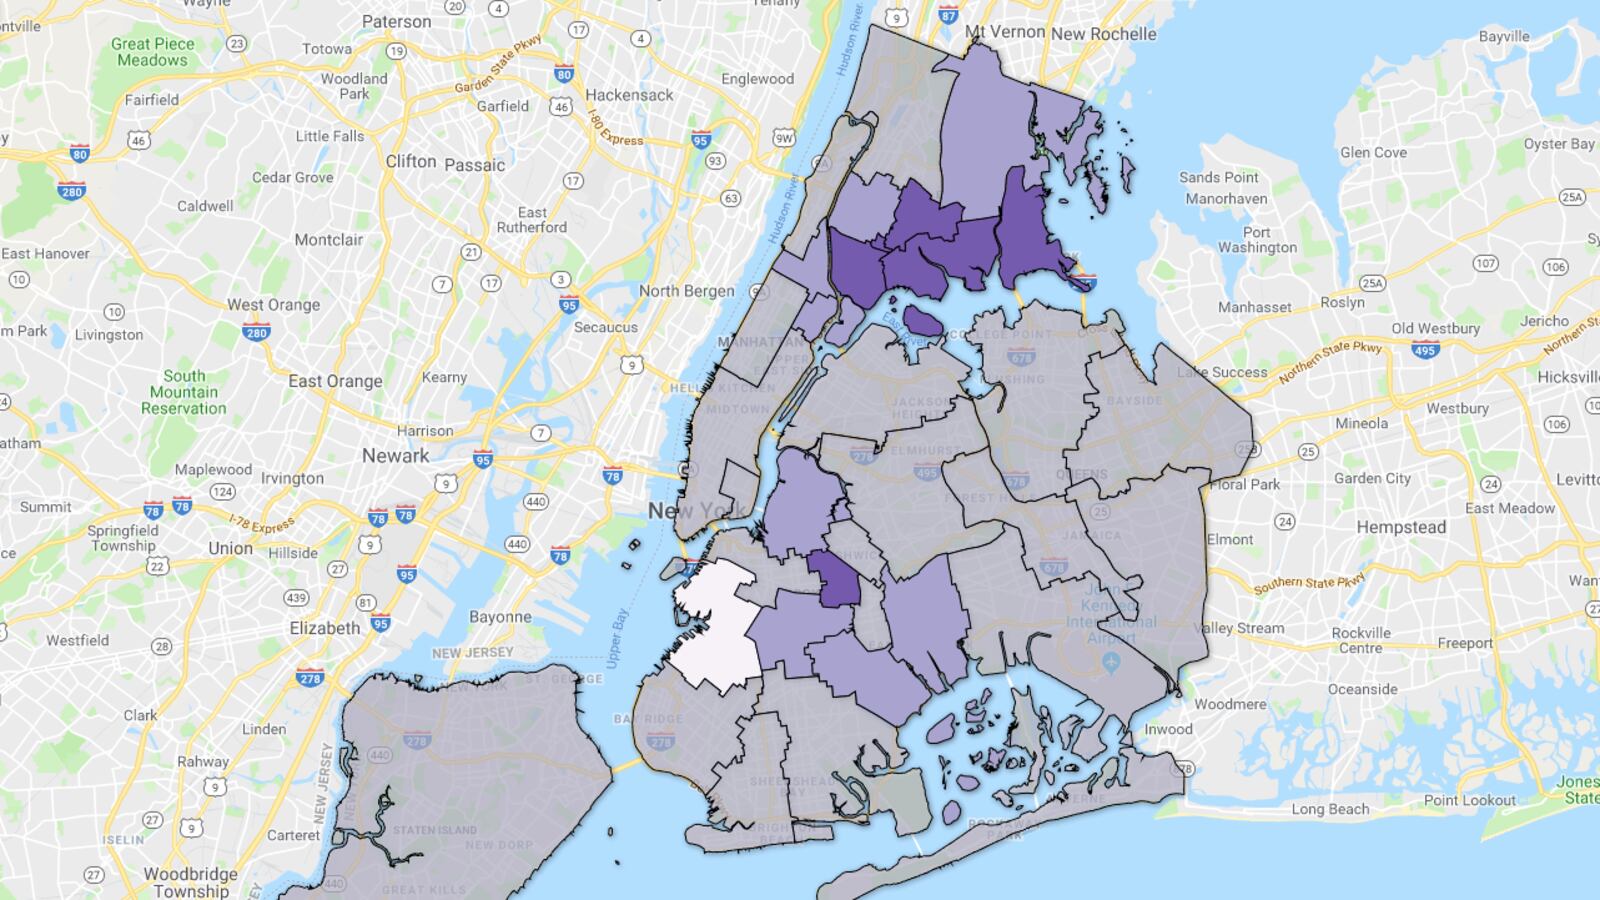
Based on data, analyzed by Chalkbeat, from each of New York City’s 32 geographical school districts from last school year, the chances of a student being suspended varied widely across different neighborhoods.
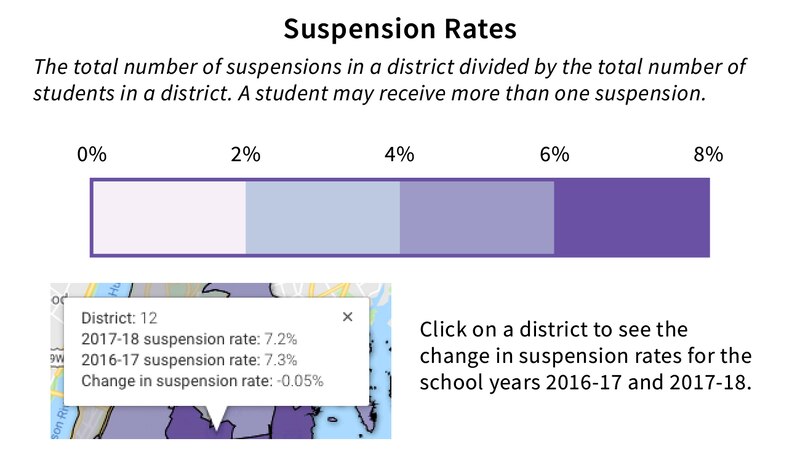
District 12 in the Bronx had the highest suspension rate — 7.2 percent — roughly double the city average. Ninety-four percent of students in the district are black or Hispanic, and 92 percent come from low-income families, the second-highest poverty rate in the city. (The district was also the site of a deadly school stabbing last year, the first fatality in a city school in roughly two decades, which schools Chancellor Richard Carranza recently said may have led to a rise in suspensions last school year.)
At the other end of the spectrum is District 15, which covers parts of brownstone Brooklyn, including Park Slope. There, the suspension rate was just 1.8 percent last year, the lowest in the city. The district is 50 percent black or Hispanic and 58 percent low-income, far below city averages.
Advocates have long pointed out that black students and students with disabilities bear a disproportionate share of the city’s suspensions — and Carranza has pledged to review the city’s disciplinary policies. But the data show that disparities are also deeply connected to the city’s geography and suggest that policy changes targeted at specific neighborhoods could have the most impact.
On the interactive map below, you can click on any district in the city to see its suspension rate for each of the past two school years. The statistics include principal suspensions, which are for less serious infractions, and superintendent suspensions, which can last for an entire school year.
The data comes with an important caveat: The suspension rates are calculated by dividing the total number of suspensions by the number of students in each district. Because students can be suspended more than once, the rate does not necessarily reflect the exact proportion of individual students who were suspended.
And if you’re curious about the number of suspensions your school handed out, you can find that data in our searchable database here.