It’s difficult to find good news for Detroit schools in newly released national test score results.
Not only did students in the city’s main district rank dead last — for the fifth time — among major cities in every subject, but their scores dropped even lower than the rock-bottom numbers Detroit fourth-graders posted the last time they took the exam in 2015.
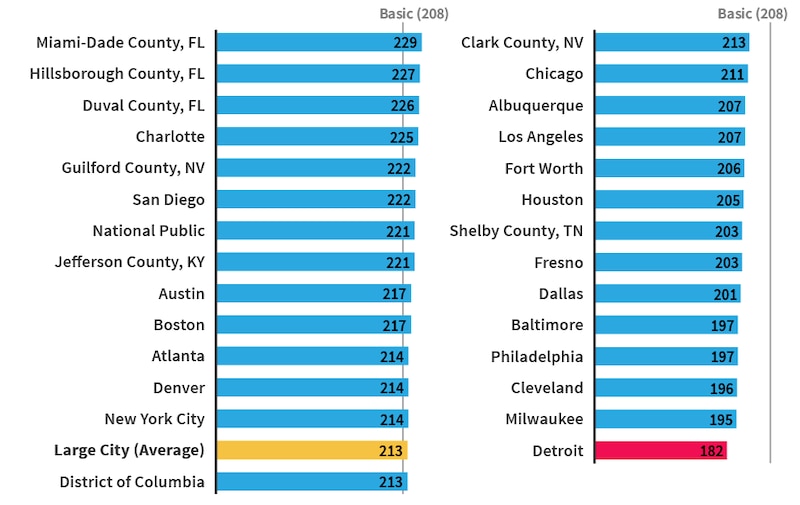
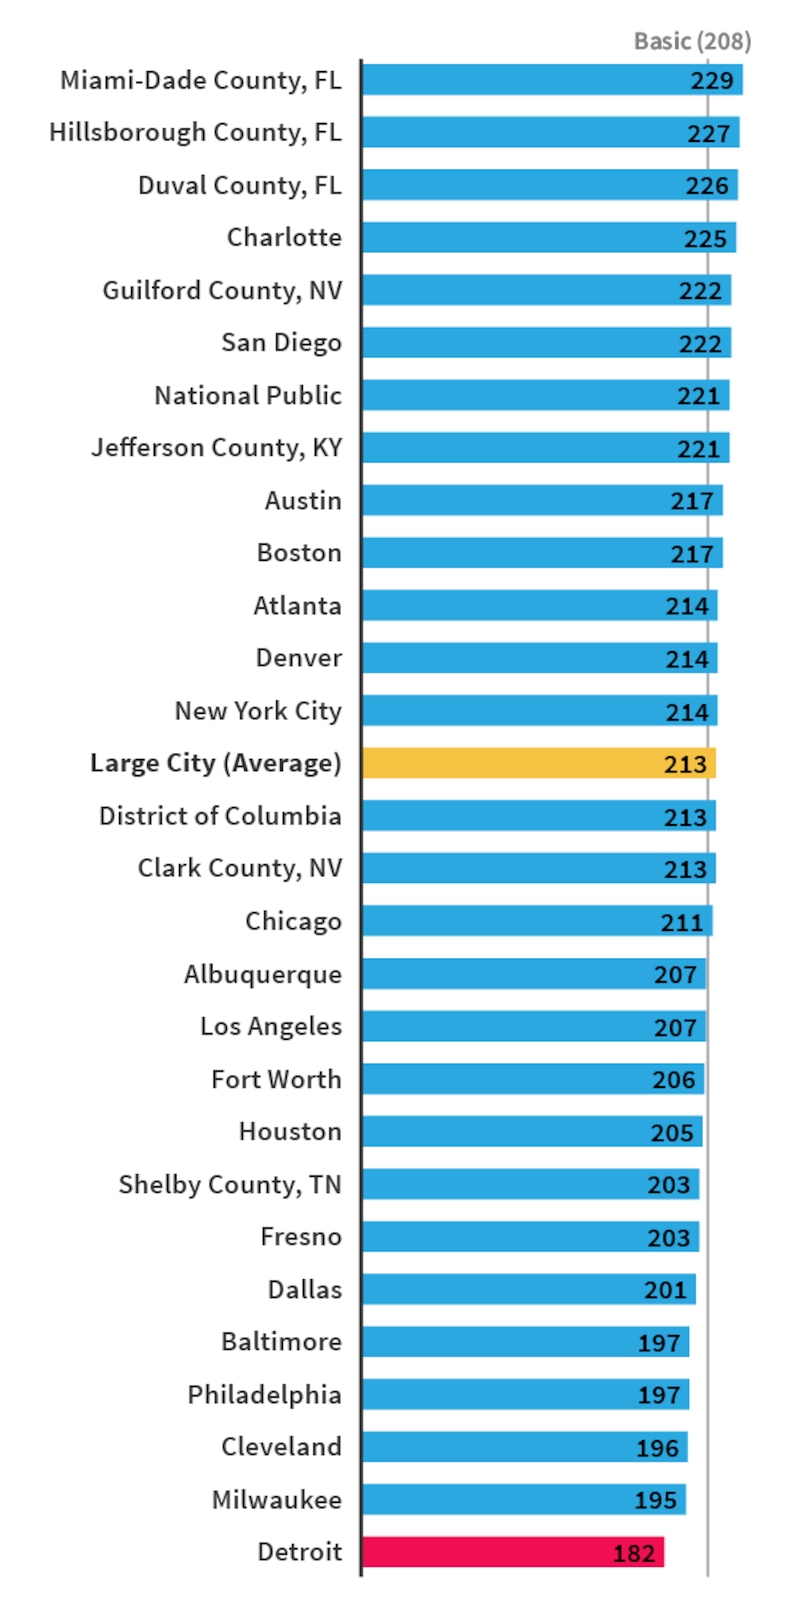
The biggest drop came in fourth-grade math, where the city’s average score fell 5 points between 2015 and 2017.
The test, called the National Assessment of Educational Progress or NAEP, was given to a representative sample of students in the first few months of 2017, shortly after a new school board took over the district, but before Superintendent Nikolai Vitti was hired.
The poor showing put an exclamation point on years of turmoil in the city’s main school district.
Detroit schools saw a rotating cast of emergency managers, teacher walkouts over unsafe building conditions, and plunging enrollment that created a financial crisis. It was so severe that the Detroit Public Schools only avoided bankruptcy in 2016 when state lawmakers created a new debt-free district called the Detroit Public Schools Community District.
During that time, a teacher shortage forced schools to crowd 30 or 40 students into some classrooms. And educators have been using a curriculum so outdated that a recent audit found students had largely been set up to fail.
Given all of that, few experts were expecting strong results on the NAEP — a test often called the nation’s report card.
“There’s just been so much instability in this district for so long,” said Mike Addonizio, a professor of educational policy at Wayne State University. “I think you would be hard-pressed to find other urban districts that have had the disruption that Detroit has had.”
The exam is given to students across the country every two years.
Detroit is one of the large urban districts that voluntarily participates in a comparison of big city schools called the Trial Urban District Assessment, or TUDA. This year, 27 districts participated.
Detroit, which has taken part in the urban district comparison since 2009, has ranked last every year that it has participated.
But the district also faces more significant challenges than those in other cities.
According to U.S. Census data, Detroit has the lowest median household income and the highest percentage of families living in poverty compared to people who live within the boundaries of the other 26 districts.
The data show that half of families with children under 18 in Detroit live in poverty.
Poverty is a major predictor of how well students perform on standardized tests, but it doesn’t tell the whole story.
It doesn’t explain why Detroit students dropped 5 points in fourth-grade math compared to two years or earlier, or why some cities do well despite high poverty rates.
Fourth-graders in Jacksonville, for example, posted the highest math scores among participating districts even as poverty within the boundaries of the Duval County Public Schools is higher than in seven other TUDA districts.
The scores in Jacksonville are perhaps the only glimmer of hope that Detroiters can turn to in the test results.
Those Jacksonville fourth-graders posted one of the largest math gains among TUDA districts between 2015 and 2017— a jump of 5 points — at a time when Vitti was running the schools there.
Vitti, who left Jacksonville last spring to become superintendent in Detroit, had been in charge of the Duval schools since that group of fourth-graders had been in kindergarten.
He can claim credit for the improvements there and says he hopes to do the same for Detroit.
Detroit’s scores are “not a reflection of our students’ talent or potential,” Vitti said. “Instead, they are indicative of a school system that has not implemented best practices regarding curriculum, instruction, academic intervention, and school improvement for over a decade.”
Vitti said things are already changing in the district.
“This year we have focused on rebuilding the district’s infrastructure using the same strategies that led to some of the highest performance among large urban school districts in Duval, Miami-Dade, and Florida in general,” he said. “This includes a focus on training teachers and leaders on the Common Core standards, implementing data systems to monitor student performance and provide intervention, and curriculum that is aligned to the standards. We simply need time and space to build capacity and improvement will be seen by 2020’s administration of NAEP.”
Sarah Lenhoff, an education researcher and assistant professor at Wayne State who specializes in school improvement and choice said the strong scores in Duval are encouraging news for Detroit.
“That’s more evidence that Dr. Vitti was a good hire and might know how to boost Detroit in the same way Duval was boosted,” said “We need to focus on instruction, high-quality teaching, trying to move to a more rigorous and aligned curriculum.”
Duval’s fourth-grade reading scores were unchanged between 2015 and 2017 while eighth-grade scores remained flat, with math up 1 point and reading down 1 point — changes so small that testing officials said they were not statistically significant.
In Detroit, the 5-point drop that fourth-graders posted in math on the 2017 exam was identified as a statistically significant decline by the exam’s creators.
Fourth-grade reading scores also dropped 5 points, but that change was not identified as statistically significant.
The Detroit eighth-graders who took the test in 2017, meanwhile, posted similar scores to students who took the test two years earlier, with math scores up 1 point and reading scores down 2 points — changes that were not identified as significant.
Ron French and Mike Wilkinson, of Bridge Magazine, contributed to this report.
Chalkbeat and Bridge Magazine, members of the Detroit Journalism Cooperative, teamed up to cover the nation’s report card on schools. Click here to see Bridge’s report on Michigan scores.
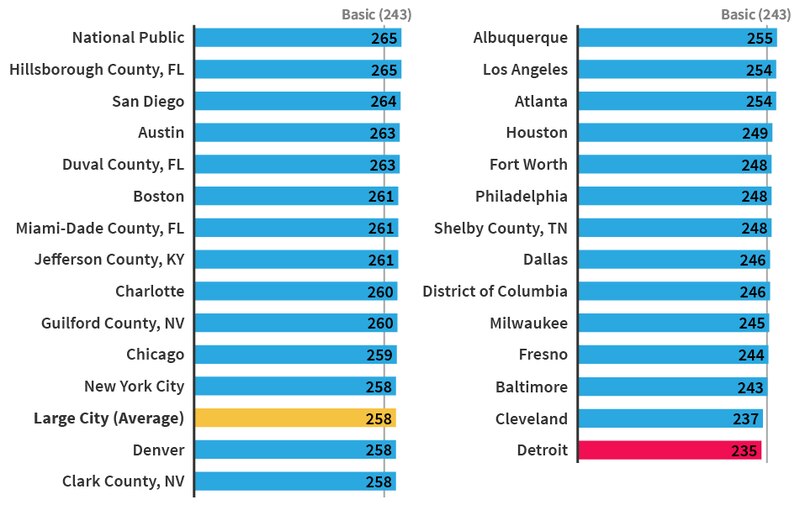
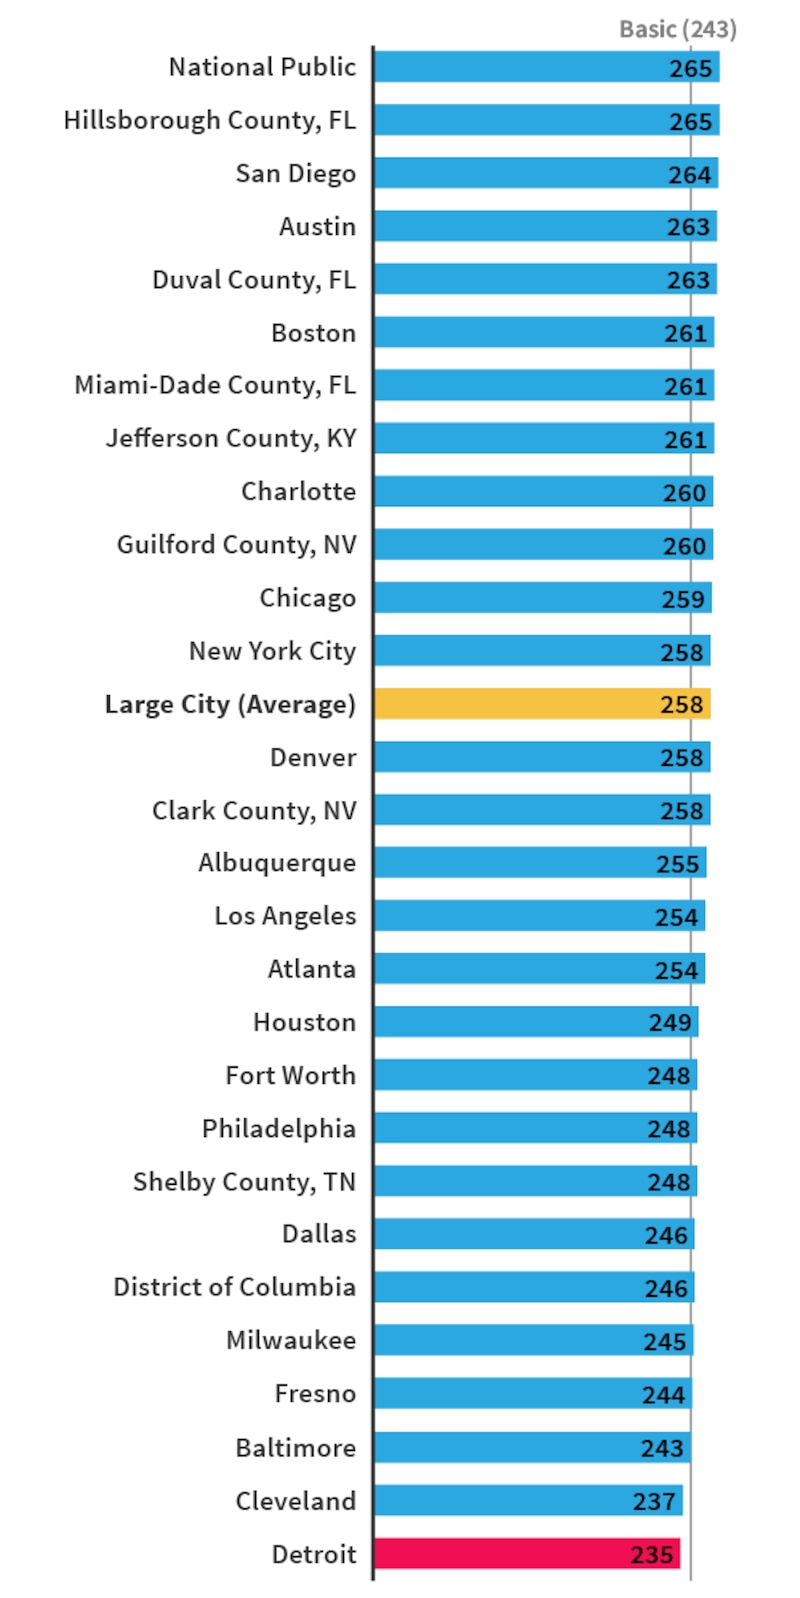
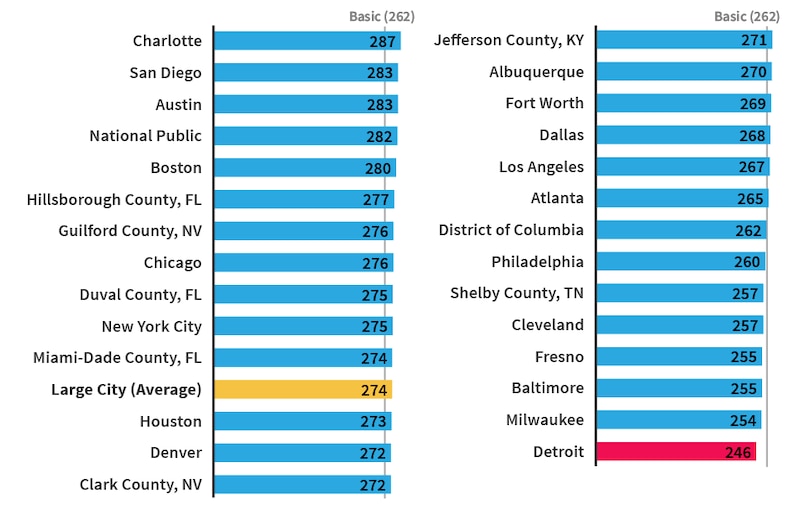
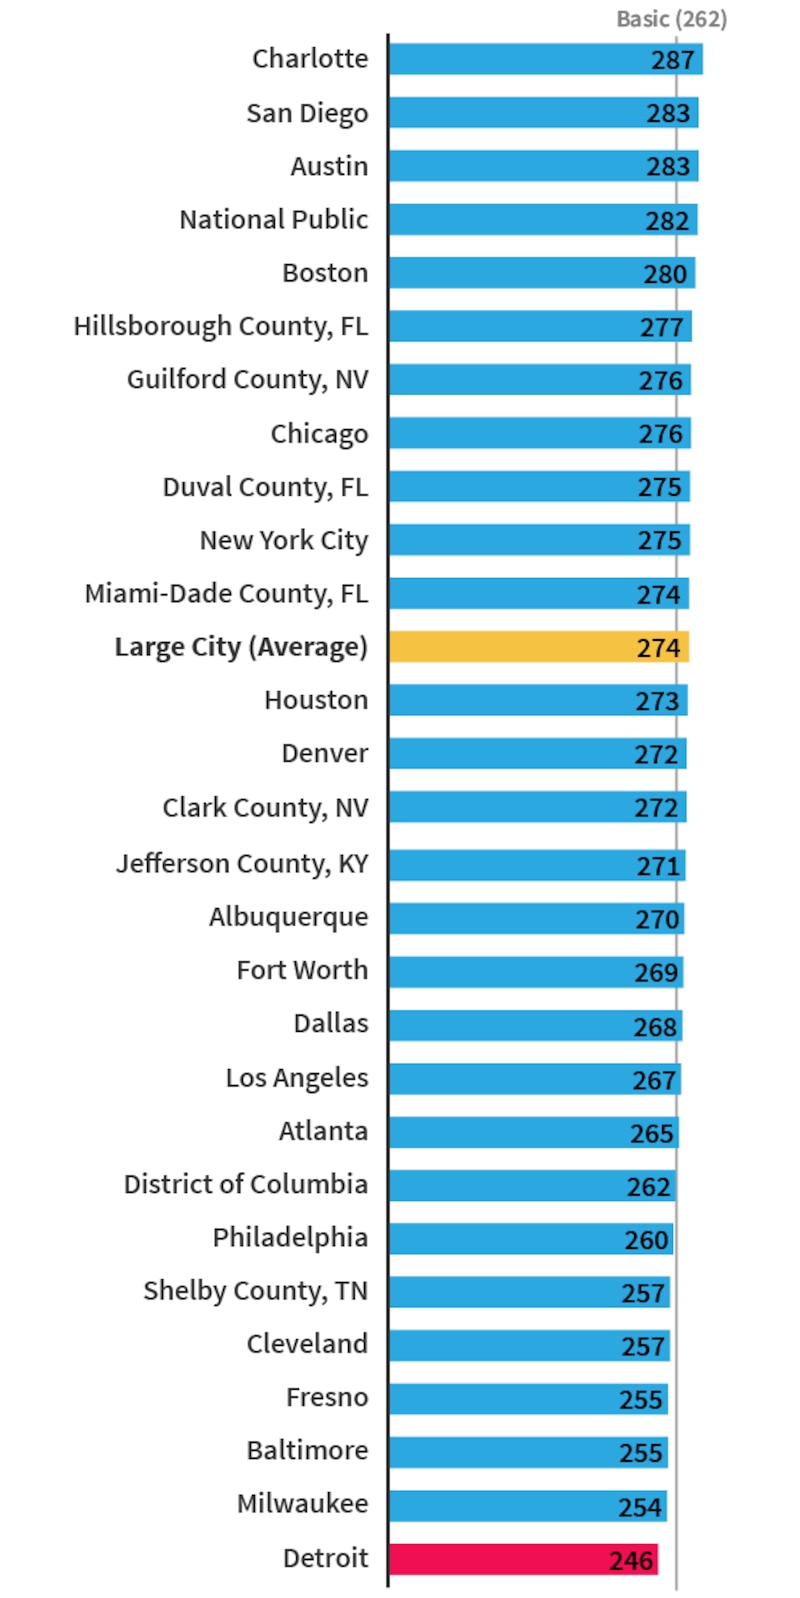
2017 NAEP Trial Urban District Assessment Rankings for 4th Grade Math
2017 NAEP Trial Urban District Assessment Rankings for 8th Grade Math
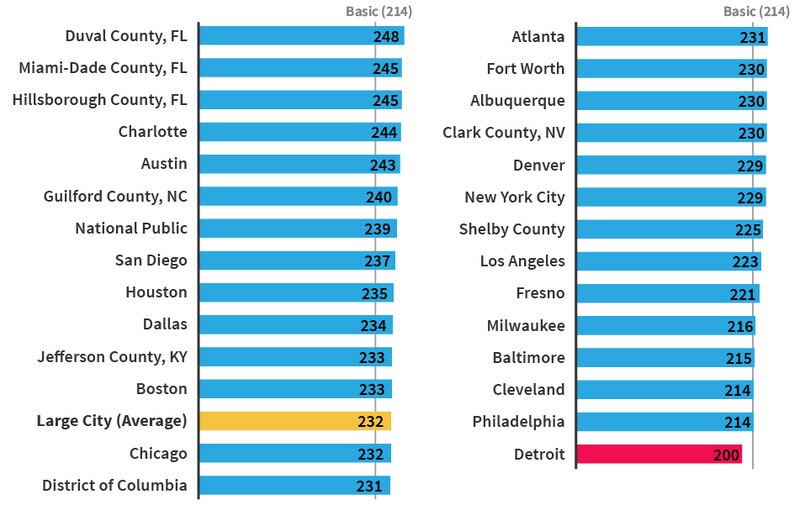
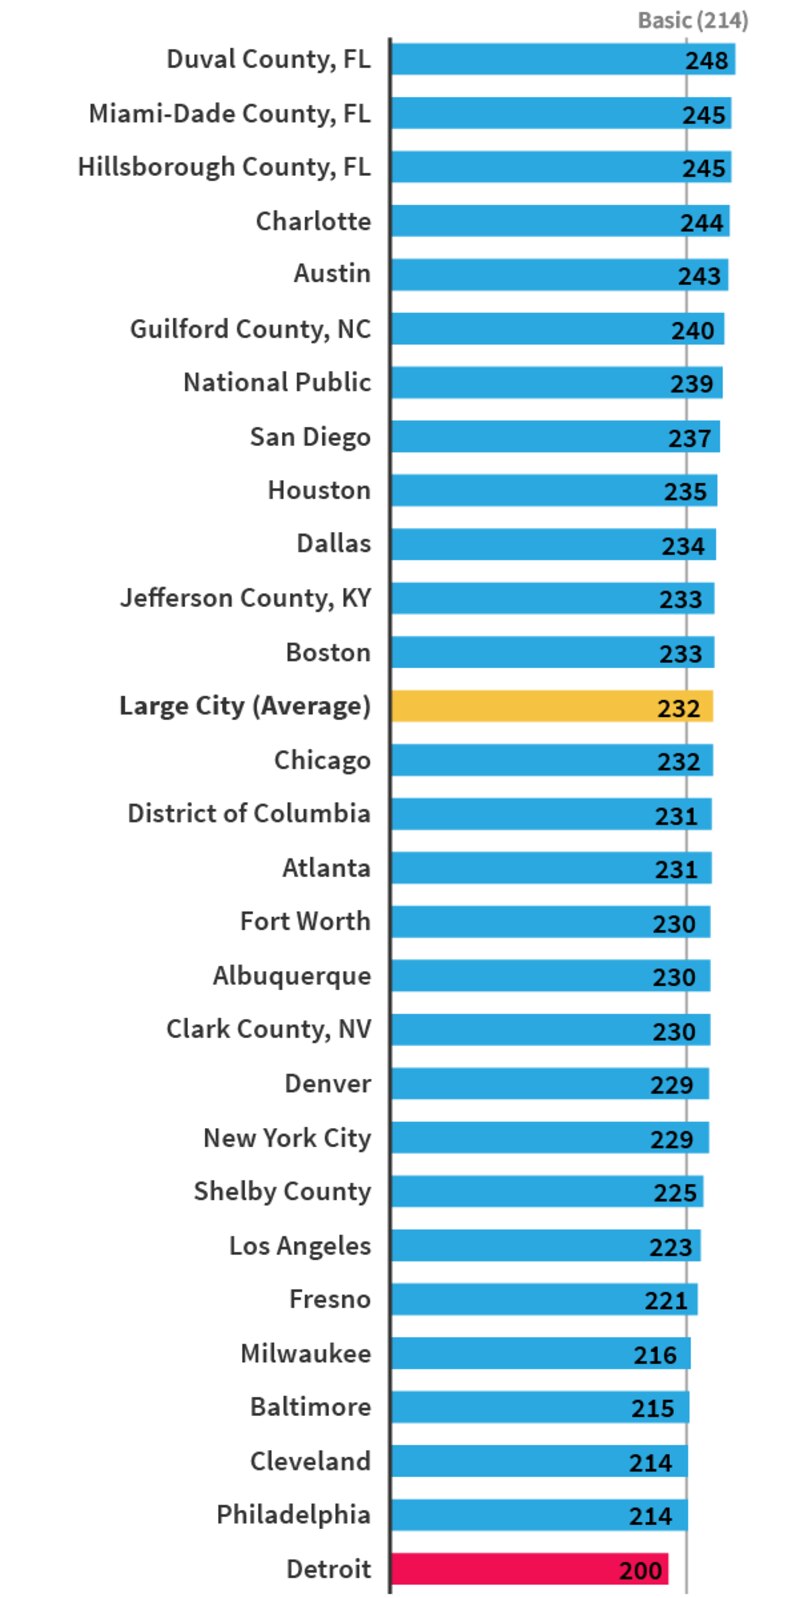
2017 NAEP Trial Urban District Assessment Rankings for 4th Grade Reading
2017 NAEP Trial Urban District Assessment Rankings for 8th Grade Reading