
Yesterday, New York released the results of the 2009 English Language Arts (ELA) assessment administered in January to students in grades 3 through 8 across the state. Overall, there was a sizeable increase from 2008 to 2009 in the percentage of students who achieved the standard of proficiency in ELA, from 68% of all students in grades 3 through 8 in 2008 to 77% in 2009. In contrast, the scale scores which underlie the proficiency standards did not increase as much, rising an average of four points across the six grades in 2009, just one point more than the increase observed in 2008.
In New York City, the results were even more striking, with the percentage of students in grade 3 through 8 who reached the standard of proficiency in ELA rising from 58% in 2008 to 69% in 2009, an increase of 11 percentage points. The increase in sixth grade is astonishingly large; whereas 53% of New York City sixth-graders attained the proficiency standard in 2008, 73% did so in 2009, a whopping increase of 20 percentage points. Taken at face value, figures such as these suggest that students’ English Language Arts achievement increased dramatically from 2008 to 2009. Some observers, including me, worry that the increases exceed the gains in student learning that could reasonably be expected from changes in instruction occurring over the course of a single year. The changes could reflect the kind of score inflation that testing expert Dan Koretz wrote about in his recent book Measuring Up.
There are multiple ways to look at the distribution of ELA performance in 2008 and 2009, and other approaches yield a different estimate of the magnitude of the gains. The percentage of students meeting the proficiency standard represents a binary threshold—a student is either above the bar or below it. If you believe that the proficiency standard means something beyond the context of a particular test, then increasing the number and percentage of students who achieve that standard is an important accomplishment. But the percentage of students who meet the standard tells you very little about the performance of low-achieving students who are well below the proficiency bar, and very little about the performance of high-achieving students who are well above the proficiency bar. The average scale score takes into account the performance of all students who take the state ELA test, and changes in average scale scores over time may be as meaningful, and perhaps more so, than changes in proficiency rates.
New York City has an unfortunate habit of referring to changes over time on the state assessments as increases or decreases in “points,” where the points refer to percentage point differences in proficiency rates from year to year. This is potentially misleading because percentage points are an arbitrary metric when applied to a threshold measure such as the percentage of students who are proficient. Still, comparisons over time that are made in terms of percentage points aren’t going away. The challenge is figuring out if they are large or small.
Another way of representing changes over time is to look at the extent to which the distribution of scale scores in a year has shifted from the distribution of scores in the prior year. For example, we can look at the mean scale score for the ELA assessment in a given grade in 2009 and see how much larger or smaller it is than the mean scale score for that grade in 2008. In New York City, the average scale scores increased from four to 10 points between 2008 and 2009. Here again, the issue is whether this is a little or a lot. To gauge this, I’m representing the scale score increase in relation to the 2008 score distribution. If the 2008 average scale score is at the 50th percentile of the 2008 distribution, and assuming that the 2008 distribution follows the familiar bell-shaped normal curve, how many percentiles higher is the average scale score in 2009?**
The figure below shows both the percentage point increase between 2008 and 2009 in the percent of students who achieved the ELA proficiency standard in grades 3 through 8, as well as the percentile increase for the average score from 2008 to 2009. In five of the six grades, the percentage point increase in the percent of students who achieved the proficiency standard exceeded the percentile increase from 2008 to 2009, and often substantially so. Still, the percentile increases are nothing to sneeze at.
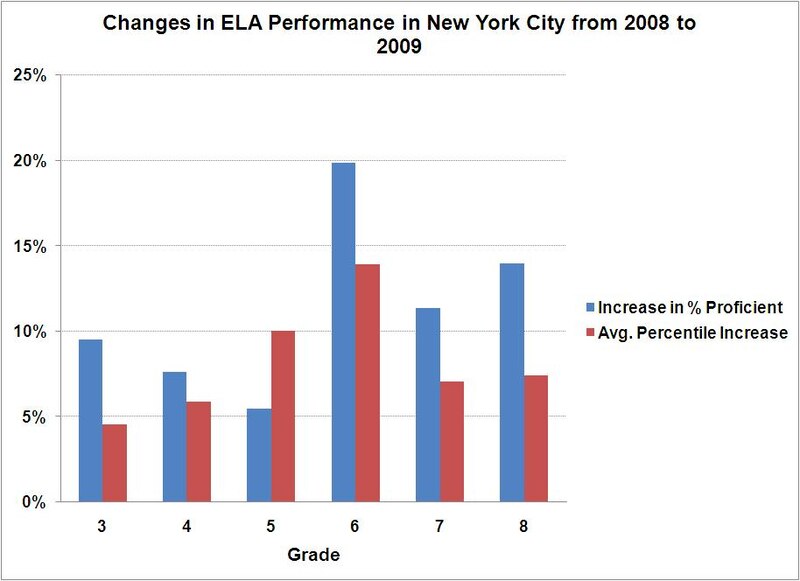
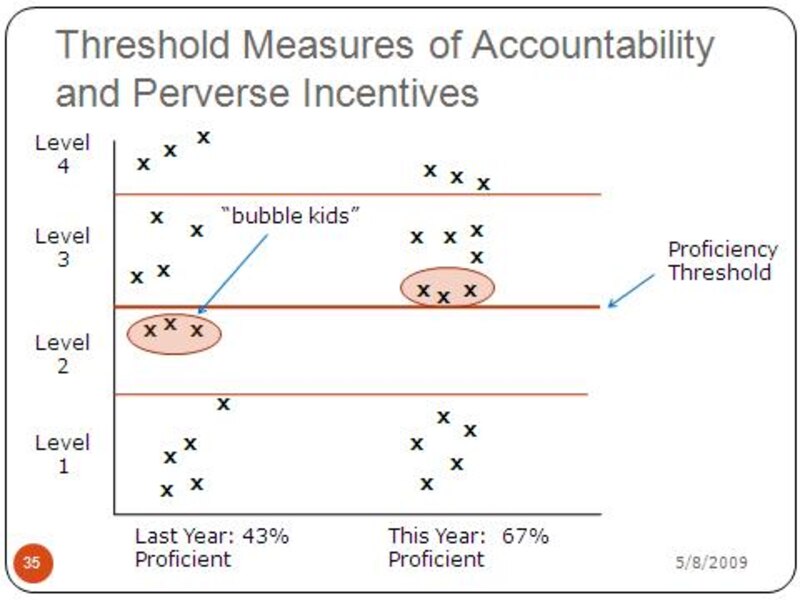
How might we explain why the percentage point increase in the percent of students who achieve the proficiency standard exceeds the percentile increase in the average scale score? One possibility is that the gains that were observed from 2008 to 2009 were concentrated in the range of scores near the proficiency threshold. Boosting the scores of students near the threshold just a bit could push them over the bar without dramatically increasing the overall distribution of achievement. We can’t be sure that this is what’s happening, but the figure below gives a graphic representation of the process. The phenomenon at issue is known as focusing on the “bubble kids,” those students whose performance is just below the threshold. In the figure, moving the three “bubble kids” from just below the proficiency bar to just above it increases the percentage of students who are proficient from 43% to 67%, a 24 percentage point increase. My colleague Jennifer Jennings was influential in bringing to national attention the incentives that threshold-based accountability systems such as No Child Left Behind create for focusing on the bubble kids to the exclusion of other students.
I’d love to believe that the increases in performance observed on the ELA assessment in New York City and across the state represent real and enduring changes in what students know. Seeing gains of similar magnitude on the 2009 National Assessment of Educational Progress would go a long way in convincing me.
**The percentile increases may be overly generous, because they are based on the amount of spread in the 2008 score distribution in New York City, which in some grades was substantially smaller than was observed in those grades in the years 2002 through 2007. If the standard deviation used to calculate these percentile gains were larger, the percentile gains would appear smaller.
About our First Person series:
First Person is where Chalkbeat features personal essays by educators, students, parents, and others trying to improve public education. Read our submission guidelines here.