
A longstanding selling point of the charter school movement has been budget independence — that is, schools are given the freedom to allocate resources as they see fit, relatively free from government control. We decided to explore how this freedom is affecting allocation decisions.
We analyzed the spending breakdown, specifically as it relates to teacher salaries and classroom instruction expenditures, and found that, on average, charter schools devote 10 percent more of their budgets to teacher salaries and 14 percent more of their budgets to classroom instruction as compared to the Department of Education’s budget for traditional schools. A full spreadsheet with individual school budgets, the total DOE budget, and our calculations is available here.
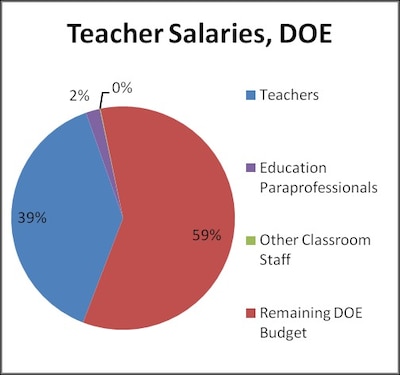
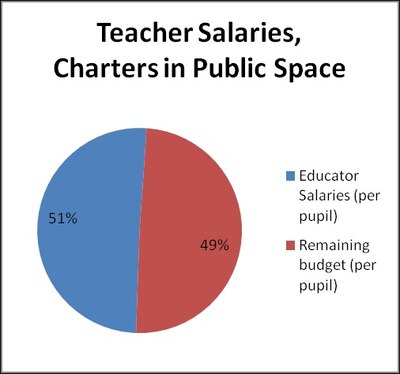
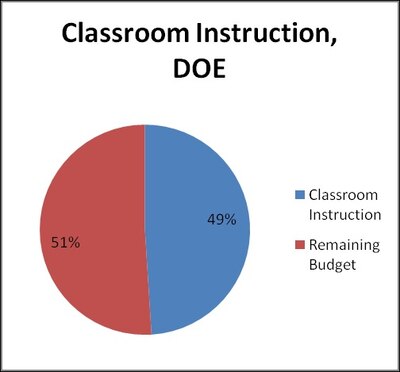
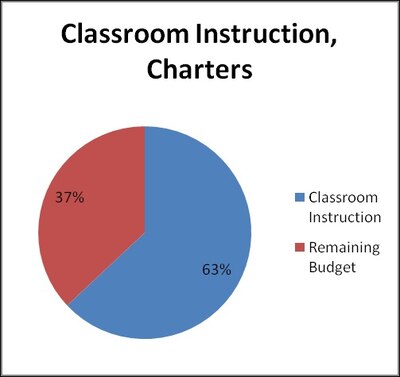
Overall, the DOE devotes around 41 percent of its budget to paying teachers, paraprofessionals, and other classroom aids. Charter schools in public space devote around 51 percent of their budgets to program salaries, which are salaries associated with classroom instruction. Classroom instruction, which includes funds spent on teacher salaries, classroom materials, student afterschool programs, and professional development, makes up 49 percent of the DOE’s total budget and 63 percent of publicly-housed charter school budgets.
Charts comparing these budgets are below:
Methods:
In order to compare the DOE’s budget to charter school budgets, we used two different methodologies which gave largely the same result. In our first method, we looked at how much the DOE spent per pupil on each of its budget items, as reported on this page. We then compared those amounts to how much charter schools spent per pupil on things like program salaries and classroom equipment. To figure out the percentage of charter school budgets that went to these expenses, we used our calculated per pupil expense (discussed in this blog post) and added to that amount the $3,929 that the Independent Budget office estimates charter schools get in in-kind services from the DOE. However, because there have been many criticisms of the IBO report, we decided to compare the budgets a different way: by subtracting the cost of things that charters get in kind, like transportation and food services, from the DOE budget. The results were largely the same: Although the percentage of the total budget that was devoted to teacher salaries and classroom instruction changed, the difference between the DOE’s numbers and charter schools stayed constant.
Other Notes:
- I left out KIPP Academy because their Statement of Activities included many non-school related expenses, like the KIPP to College costs, which were difficult to parse.
- In some cases, items that the IBO listed as charters receiving were not listed on the DOE’s page (like Software and Health expenses). Since these were relatively small additions to charter budgets, I left them out.
- Although the DOE budget was for 2007-2008 and the charter budgets were from 2008-2009, I think the comparison is fair, as the percentage breakdown of DOE spending does not seem to change much from year to year.
- I think it is important to separate charters that are housed in public space from those who must pay occupancy costs — for that reason, I believe the public charter to DOE comparison is most accurate, but I included the other numbers in the spreadsheet for comparison’s sake. As always, we welcome feedback and ways to improve our calculations!
As always, we welcome feedback and ways to improve our calculations!
About our First Person series:
First Person is where Chalkbeat features personal essays by educators, students, parents, and others trying to improve public education. Read our submission guidelines here.