Anyone with online access can now look up the first year of comprehensive results under Tennessee’s new standardized test for 1,800-plus schools and 146 districts.
Tennessee’s Department of Education unveiled the latest version of its State Report Card on Wednesday, providing TNReady results from 2016-17, the first year that the test was completed by all grades. The previous year, only high schoolers finished TNReady due to a series of online and logistical failures.
The latest scores were released last fall, but the new report card displays the information in a more useable and accessible format. State officials say it’s the most comprehensive online snapshot yet. Data includes multiple achievement and growth measures and other metrics such as student enrollment, HOPE scholarship eligibility, and school climate, as well as how much each district spends per pupil — all in one central location.
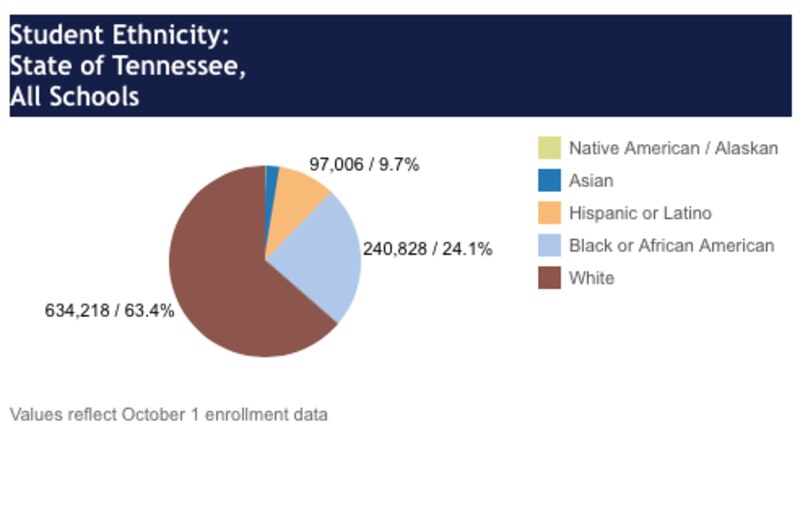
Also available: school-by-school data on student ethnicity and the percentages of those who are economically disadvantaged, have disabilities, or are English learners.
“The state Report Card provides a clear picture for parents, educators, and communities to see how our schools are performing, locally and across the state,” said Commissioner Candice McQueen in a statement.
TNReady replaces the state’s old TCAP assessment and provides the first complete look at student performance since Tennessee switched to a test aligned to the Common Core academic standards, which are aimed at problem-solving and critical thinking skills. Statewide scores released last fall showed that most elementary and middle school students lag in English and math, many significantly, while most high school students saw their scores rise in the second year of testing.
The report card also includes the baseline-setting results from a new optional grade 2 assessment, which was administered in 100 districts in its first year.
Here are some statewide highlights from the 2016-17 report card:
- Graduation rate: 89.1 percent
- ACT composite score: 20.1
- Economically disadvantaged students: 34.7 percent
- Students with disabilities: 13.95 percent
- English learners: 5.3 percent
- Per-pupil expenditure: $9,957.80