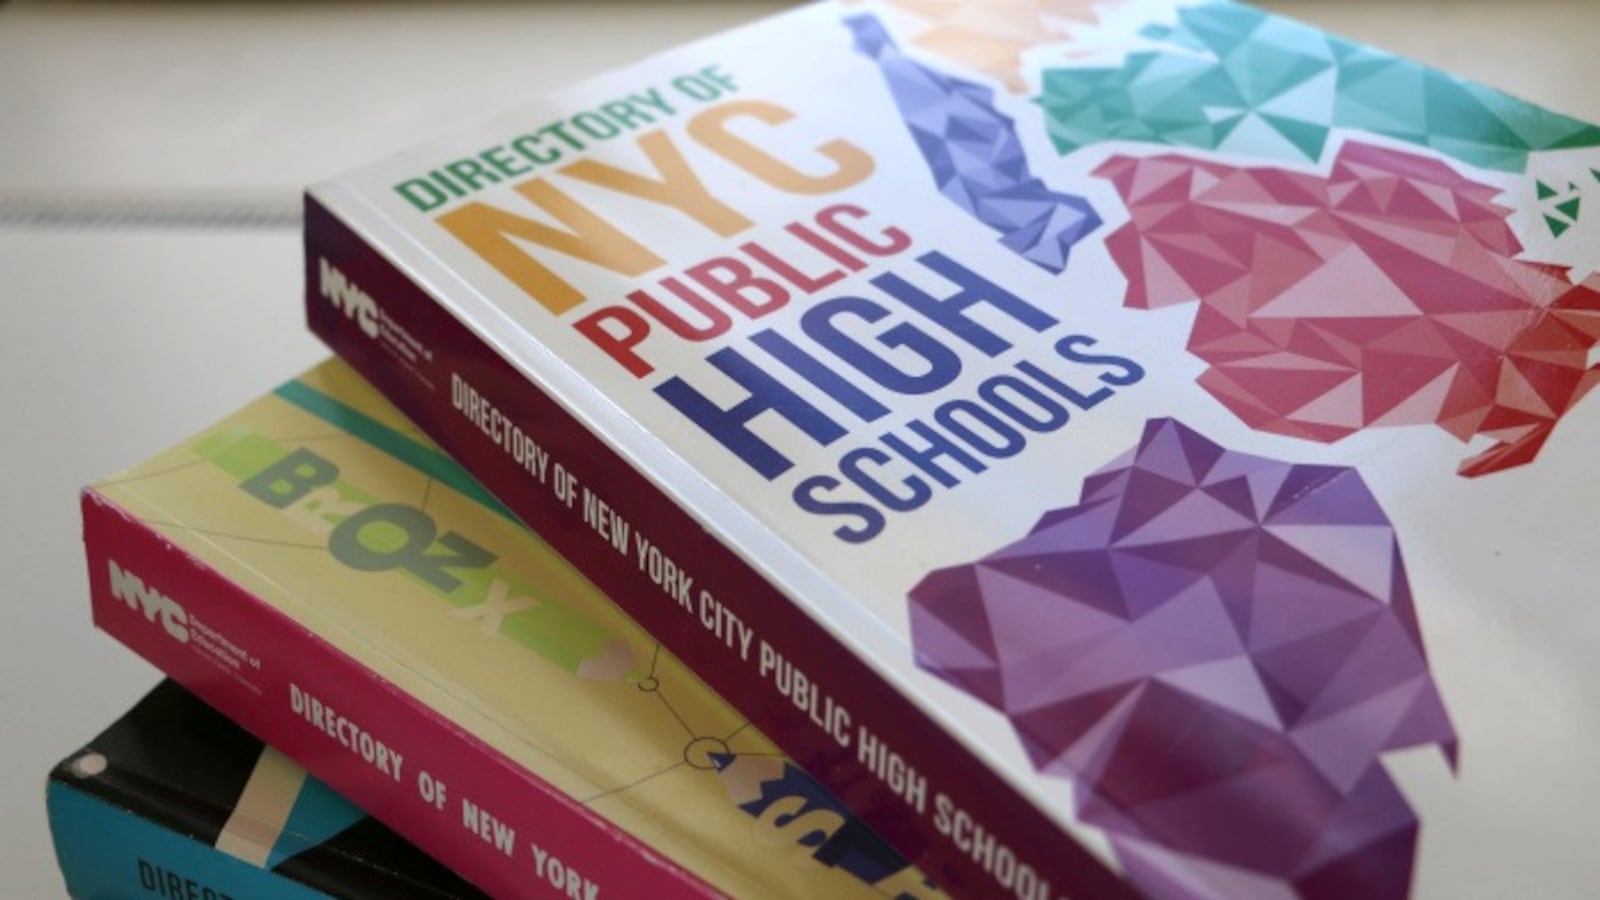
Next year’s high school directory is out, and it reflects a few de Blasio administration priorities, including a new notation for “community schools.”
The 649-page book, meant to guide students and families through the city’s all-choice high school admissions process, has a history of reflecting the city’s latest policy changes. Last year, the directory dropped school letter grades, previewing the city’s move away from the accountability metrics created by the Bloomberg administration. Graduation rates were first included in 2010, and earlier directories included lists of schools on the state’s watch list for low performance as the city worked to close struggling schools.
The newest guide continues the city’s bid to make school data more family-friendly by emphasizing absolute performance, not a school’s progress over time or its success compared to other schools.
Here’s what’s new this time:
- Thirty-five high schools now have the “community school” designation. That includes some that will be adding community partnerships, mental heath resources, and other services for students and families next year though a program Mayor Bill de Blasio announced last December.
- Part of each school’s listing now resembles the school “snapshots” meant for families. Each listing includes a visual representation of a school’s last quality review, the in-person evaluation conducted every few years by superintendents and which is receiving new emphasis under Chancellor Carmen Fariña. Each school earns one to four colored bars in five categories: having an interesting and engaging curriculum, having effective instruction, assessing student learning, communicating high expectations, and teacher collaboration. (That leaves some big blanks for some schools that haven’t had a recent quality review.)
- The new directory no longer includes the percentage of students on track after ninth grade. That metric has been shown to be a reasonable predictor of future graduation rates. Four-year graduation rates, and the percentage of students who graduate and go on to college or enroll in career programs, are still included.
- Comparisons among schools have changed, too. A school’s four-year graduation rate is compared to a borough average, not to a historical average of schools with similar populations. That provides a better sense of a school’s overall performance but obscures whether a school is succeeding despite serving needy students.
- Two new metrics attempt to capture a school’s engagement with students and its safety. Each school’s report includes what percentage of students “feel that their school offers enough variety of programs, classes, and activities to keep them interested in school” and what percentage of students feel safe in a school’s hallways, bathrooms, and cafeteria. Those replace a more generic school-satisfaction metric.
Some of those changes might be short-lived. Proposed changes to next year’s “snapshots” add comparisons to schools to those with similar characteristics back in, and adjust the quality review categories, likely foreshadowing the next round of directory changes.

