
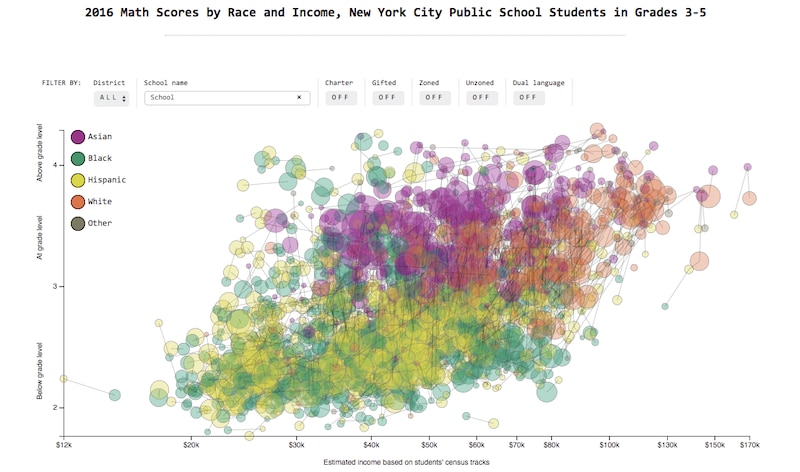
Reams of research have shown stark achievement gaps between white and Asian students and their black and Hispanic peers. But a new interactive database released Wednesday shows how pervasive the achievement gap is across the city and its roughly 900 elementary schools.
The interactive, created by the New School’s Center for New York City Affairs, shows strong correlations between students’ race and income and their elementary math scores, and also reveals that wide achievement gaps often exist even within individual schools.
The report comes with a few caveats: It is based solely on recent census data (not each family’s actual income) and last year’s math scores for students in grades 3-5, offering just one metric to judge student achievement. The graphic is also purely correlational, which means it can’t identify precisely what is causing the gaps.
Still, it offers a stark representation of the ways a student’s race, socioeconomic status, and performance are often interrelated.
Here are four takeaways the data:
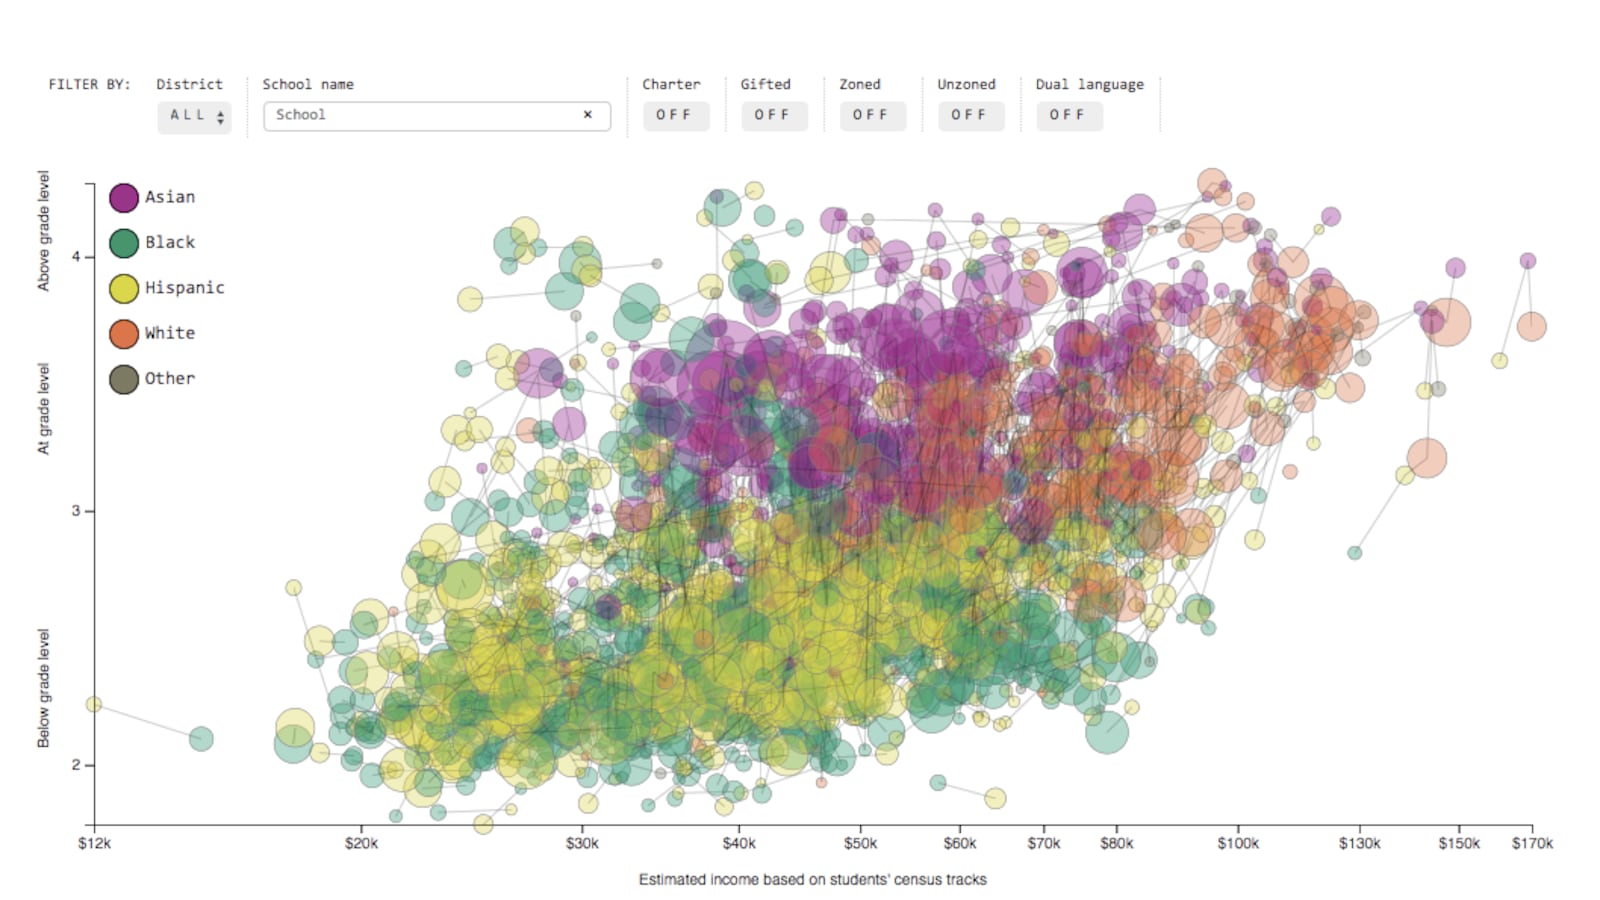
1. Math scores vary by race and income
White and Asian students (represented by red and purple dots) are generally clustered at the top right portion of the graph, meaning that they tend to have both the highest math scores and come from higher-income families. Meanwhile, the bottom left is dominated by black and Hispanic students (represented by green and yellow dots), who tend to be poorer and post lower scores.
2. Low-income students of color are doubly isolated
“Very low-income black and Hispanic students almost exclusively attend schools only with each other,” said Nicole Mader, who co-authored the report, in an email. Those students are represented on the left side of the graph.
On the other hand, white students from higher-income families often attend schools that are racially diverse — but their black and Hispanic classmates tend to also be higher income. (The report defines higher-income families as those who earn more than $60,000, rather than the $45,000 average among students in the data.)
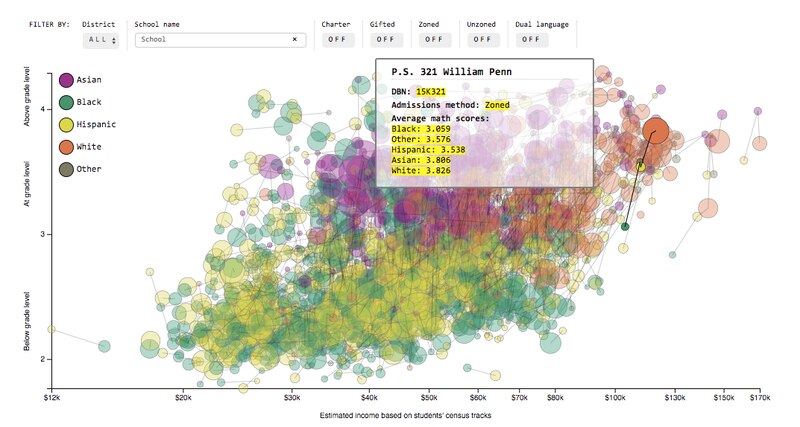
3. Socioeconomically diverse schools tend to have big achievement gaps
While relatively rare, the report identified 50 schools where students come from families whose incomes vary by more than $25,000. At those schools, the math achievement gap diverged by a full level on a four-point scale with black and Hispanic students typically scoring far below their white and Asian peers.
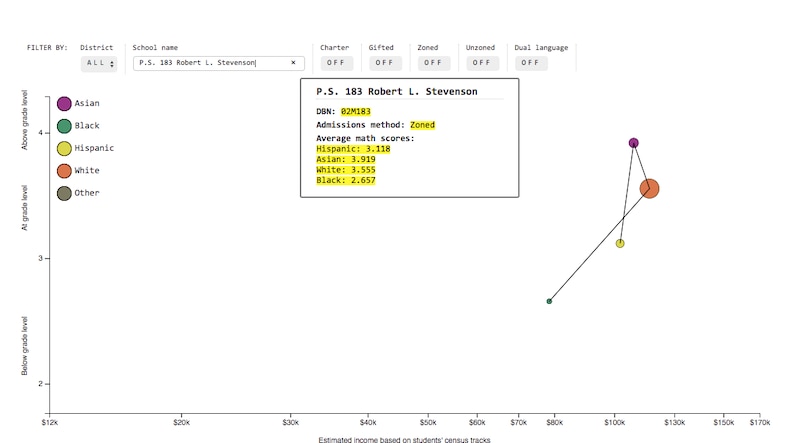
At Manhattan’s P.S. 183, for instance, Asian and white students scored a full level higher on average than their black peers.
“That’s a huge difference in test scores for kids who are in the same building,” Mader said.
4. Some schools manage to defy that trend
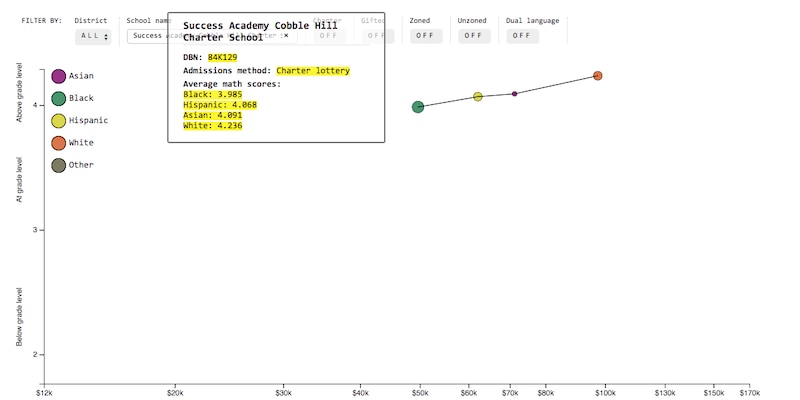
One notable exception to the trend of big achievement gaps in income-diverse schools are those that the Success Academy charter-school network that has opened in higher-income neighborhoods, such as Cobble Hill in Brooklyn. Schools like that one have managed to achieve relatively high math scores across racial groups and income levels.
“Even though their income gaps are some of the widest on this chart, their test score gaps are among the smallest,” Mader said.
The report says that just one district school has achieved similarly high scores among lower-income black and Hispanic students: P.S. 359 in the Bronx.