Sign up for Chalkbeat Philadelphia’s free newsletter to keep up with news on the city’s public school system.
School officials in Philadelphia say closures are coming — and they’ve promised to use data about building needs, enrollment, and neighborhoods to decide which schools shut their doors.
But more than a year into the district’s facilities planning process, details on which schools are desperately in need of repairs and which ones are struggling most with enrollment remain murky.
For months, the district has pushed back a promised release of the information officials have said will inform its recommendations of which schools to close, colocate, modernize, repurpose, or maintain as they are. And the data the district has shared — which officials have only made available via printouts at community engagement sessions — includes serious limitations and inconsistencies, according to principals and educators in attendance.
At community engagement meetings held by the district this month, some educators pointed out that the district’s stated capacity for their schools did not seem accurate, based on their experiences in their buildings. Others noted that the data creates an incomplete picture about the city’s enrollment, as it only captures a moment in time and does not include charter or parochial school enrollment.
Ultimately, some principals worry their schools could be targeted for closure or colocations based on data that does not accurately reflect their schools. And some community members said that failing to holistically review their schools’ strengths and challenges could result in decisions that harm children and neighborhoods.
Many educators and community members attending meetings also asked for clarification about how the data would be used to determine school recommendations. Despite assigning scores and color codes to different school factors, the district did not explain how these scores and codes could make different outcomes for schools more or less likely.
District officials said there was no formula, but that they would take many factors into account including comments and concerns shared at the meetings.
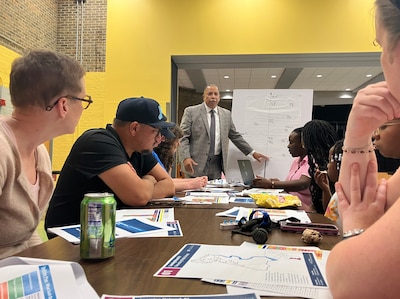
“Nothing is etched in stone,” Deputy Superintendent Oz Hill told a group of educators and community members at an engagement session at Thomas K. Finletter School. “We are still at a point where your input can make a difference.”
Chalkbeat’s analysis of the district’s data revealed further inconsistencies and gaps. The district provided Chalkbeat with a list of each district school’s capacity based on its current metrics. But the figures provided did not match the numbers shared during the engagement meetings. For example, the Abram S. Jenks School is 87% full according to the spreadsheet given to Chalkbeat. But in the printed handouts from the engagement meetings, the school has the same number of students enrolled but is marked “severely overcrowded” at over 130% full.
The data the district gave to Chalkbeat also did not include information for several schools, including schools that recently returned to district control after being operated by charter organizations.
The capacity figures the district provided to Chalkbeat and the capacity figures shared at the community meetings were “collected at different points in time,” according to Monique Braxton, a district spokesperson. The district did not further explain the discrepancies. And updated capacity data for the schools “will be available when we launch the public website,” Braxton said.
District officials have repeatedly said the data they have shared during engagement meetings is preliminary and will be updated after walkthroughs of each school and a review by principals, some of whom have been away on vacation this summer.
The new data will be released before the facilities plan is made public, several district facilitators at the meetings said.
But time is running out. The district plans to solicit feedback on a draft facilities plan beginning in October, which it will then present to the Board of Education in November.
At a session at Thomas K. Finletter School, several teachers and school leaders affiliated with Feltonville Arts & Sciences expressed concerns about the school capacity numbers the district shared at the meetings.
If the district doesn’t have accurate information on its buildings, the educators said, they have serious reservations about the validity of the process overall.
“Don’t make it neat on paper,” said Malcolm Cooper, a music teacher at Feltonville Arts & Sciences, at the risk of making things “messy in real life.”
District’s scores for schools spur confusion, concern
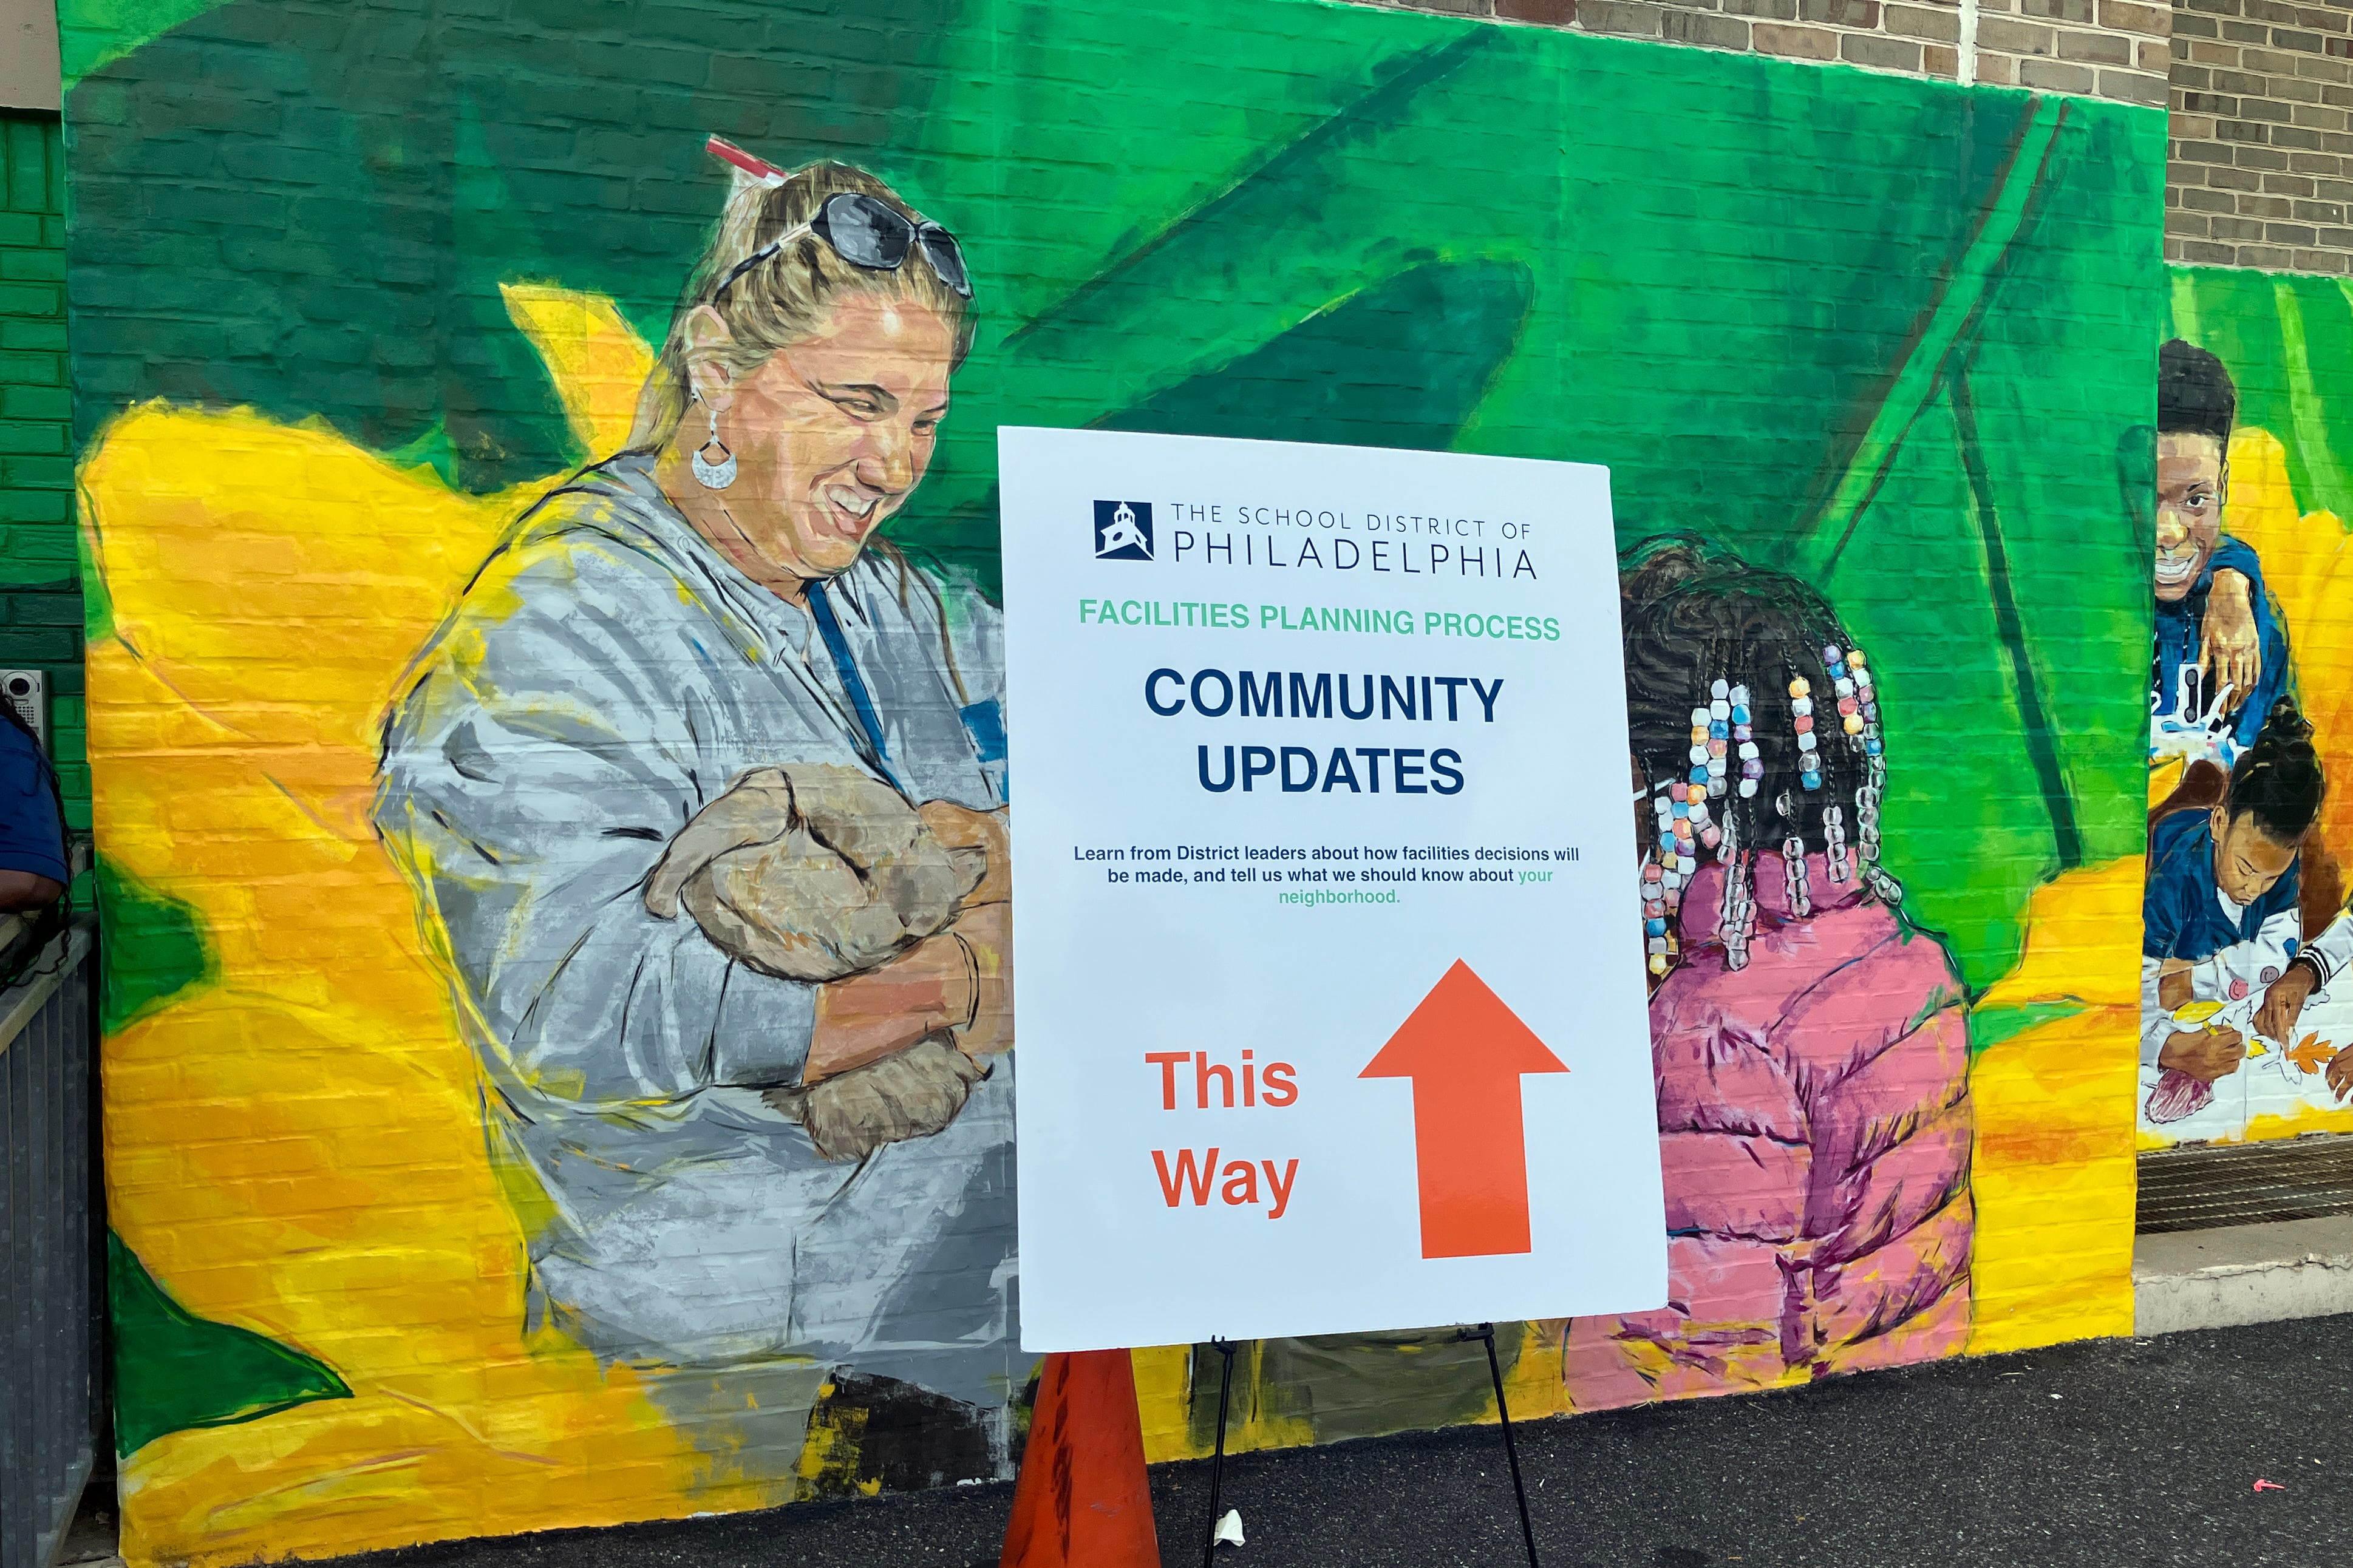
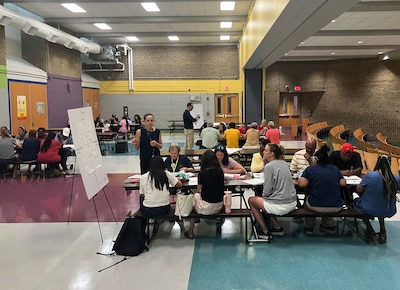
Throughout July, district officials hosted more than a dozen engagement sessions to explain the facilities planning process, solicit feedback, and share printouts of school data. Chalkbeat attended half of these sessions, speaking with parents, educators, community members, and district officials in attendance.
The data printouts included enrollment and capacity numbers, as well as color-coded designations for each school based on building quality, neighborhood vulnerability, and program alignment.
District officials said that school building scores were based largely on a 2024 building audit.
Program alignment scores reflected whether a school’s space adequately serves its programming needs, like having a gym or space for prekindergarten programs.
Neighborhood vulnerability scores combined two factors. One is the federal Centers for Disease Control and Prevention’s social vulnerability index data for a school’s neighborhood that considers poverty and housing density. The other is whether a neighborhood has experienced a district school closure in the past.
For example, a school with more students enrolled than its building capacity allows may be marked “red” for overcrowding, but have a program alignment of “good,” and a neighborhood vulnerability score of “moderate risk.”
In the community meetings, district officials have said their decisions will primarily consider the neighborhood vulnerability score, then a school’s capacity, utilization, and building’s structural condition, and then the further “nuance” of a school community, including where students could be moved and what special programs schools offer.
But the officials did not make a direct connection between how schools were ranked on these different factors and how likely it is that the district would decide to close, colocate, or modernize them.
But at every session Chalkbeat attended, at least one person asked for more clarity about how the district arrived at the summary scores for each school and raised concerns about their accuracy.
Luisa Velasquez, co-director of the Friends of Vare-Washington nonprofit that raises money to support the elementary school, said she believed the “moderate risk” vulnerability designation assigned to the school didn’t reflect the school’s real needs.
Velasquez noted that though more wealthy families have moved to South Philadelphia, many have chosen to send their kids to private schools, charter schools, or selective admissions schools. As a result, the demographics of Vare-Washington Elementary’s neighborhood don’t necessarily reflect the school’s demographics, she said, “because we have kids from all over the city coming to us to get a decent education.”
In a similar vein, others have noted that the data doesn’t capture the location of charter schools.
Velasquez told Chalkbeat she left the community meeting skeptical of how the district will use its data for decisions about schools.
School data reflects limited timeline and scope
Deputy Superintendent Oz Hill said the engagement sessions so far have been eye-opening. He urged families to attend more meetings, which district officials have said will continue throughout the fall.
“Every single engagement [session], I learn things about these schools and the communities that I didn’t know before,” Hill told Chalkbeat at one such meeting on Monday.
Some attendees also worried that the capacity data was too rigid. In Northeast Philadelphia, for example, school leaders said a growing immigrant population means a school’s enrollment can fluctuate throughout the year. If Feltonville Intermediate School filled its classrooms to 100% capacity on the first day of school, educators asked what would happen after winter break when a handful of new students want to enroll.
Sabrina Scott-Feggins, principal of General Philip Kearny Elementary who attended a session at the district’s headquarters, said she still has questions about the district’s process and calculations.
For example, since COVID, her school decided to take two underused classrooms and turn them into a makeshift library because the school didn’t have one. Though on paper those rooms may count as empty, she noted that they are in use and provide a vital resource.
But she said she was heartened by the opportunity to provide feedback directly to district officials. And as a principal, she can get on board with a decision that benefits students — even if it means reconfiguring schools.
“I feel hopeful,” said Scott-Feggins. “I feel like this is the beginning of being heard.”
Clarification: This story has been updated to more accurately reflect Principal Sabrina Scott-Feggins’ comments about the district’s planning process.
Rebecca Redelmeier is a reporter at Chalkbeat Philadelphia. She writes about public schools, early childhood education, and issues that impact students, families, and educators across Philadelphia. Contact Rebecca at rredelmeier@chalkbeat.org.
Carly Sitrin is the bureau chief for Chalkbeat Philadelphia. Contact Carly at csitrin@chalkbeat.org.