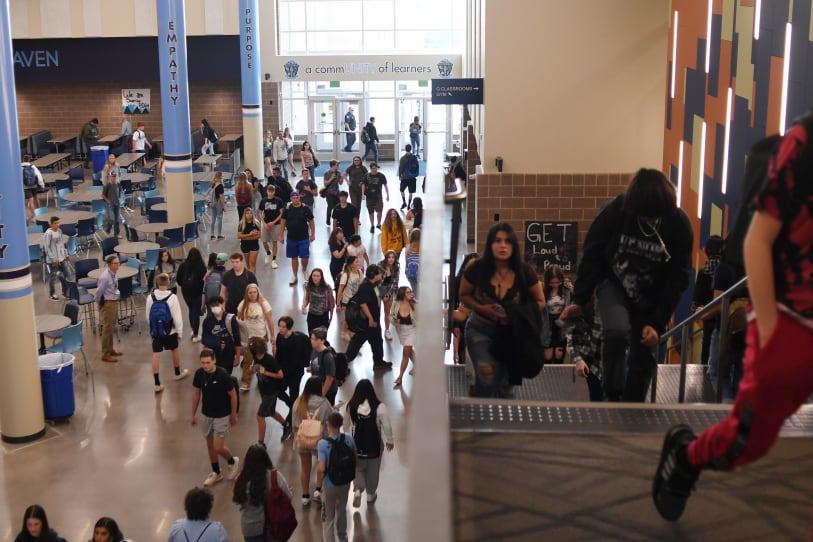
High school juniors did slightly better on the SAT than their counterparts in 2019, but ninth graders, similar to younger students, mostly scored lower than students in 2019.
The low participation rates for all tests, and the demographics of the students that opted not to take the test, raise questions about how useful or representative the information can be this year.
Two metro area school districts where freshman students saw improvements in average scores were Aurora and St. Vrain. However, participation rates for the ninth graders taking the PSAT in Aurora schools was below 40%. In St. Vrain, about 77% of ninth graders took the PSAT test. Before the pandemic, participation rates were generally above 90%.
Colorado students did not take state tests in 2020 due to the pandemic. In 2021, participation rates for the SAT test dropped, although not as low as rates for other state tests in lower grades. There was also a lot of variability from one district to the next.
The highest participation rates in the metro area were among 11th graders in Sheridan, Douglas, Littleton, and Jefferson school districts, but they were still lower than in previous years.
Statewide, some of the lowest participation rates for the SAT among 11th graders were in Byers, District 49, and Englewood.
The SAT test is used by some colleges in admissions criteria, though many are now backing away from standardized testing requirements.
SAT scores can range from 200 to 800 each on the literacy and math tests, with a maximum composite score of 1600. The statewide average composite score in 2021 was 1011, up 10 points from 2019.
PSAT scores can range from 160 to 769 on individual tests, with a maximum total score of 1520. The statewide average score for ninth-graders was 903, down from 906 in 2019.
The Sheridan school district had one of the higher participation rates for ninth graders at 82.6%. Students who took the test there had combined average scores 16 points lower than students who tested in 2019.
This year, Colorado also created ranges where the scores could be considered meeting expectations or not, and for the first time has calculated the percent of students meeting or exceeding expectations, rather than just publishing median scores.
Statewide, 10th and 11th grade students had higher average scores than in 2019, although 2019 scores dipped from 2018, and the gains this year did not surpass 2018 scores. In some cases, gains in reading and writing made up for dips in math.
Look up your school’s participation rates and achievement in the searchable database below. You can also see the state’s full data release on its website here.


